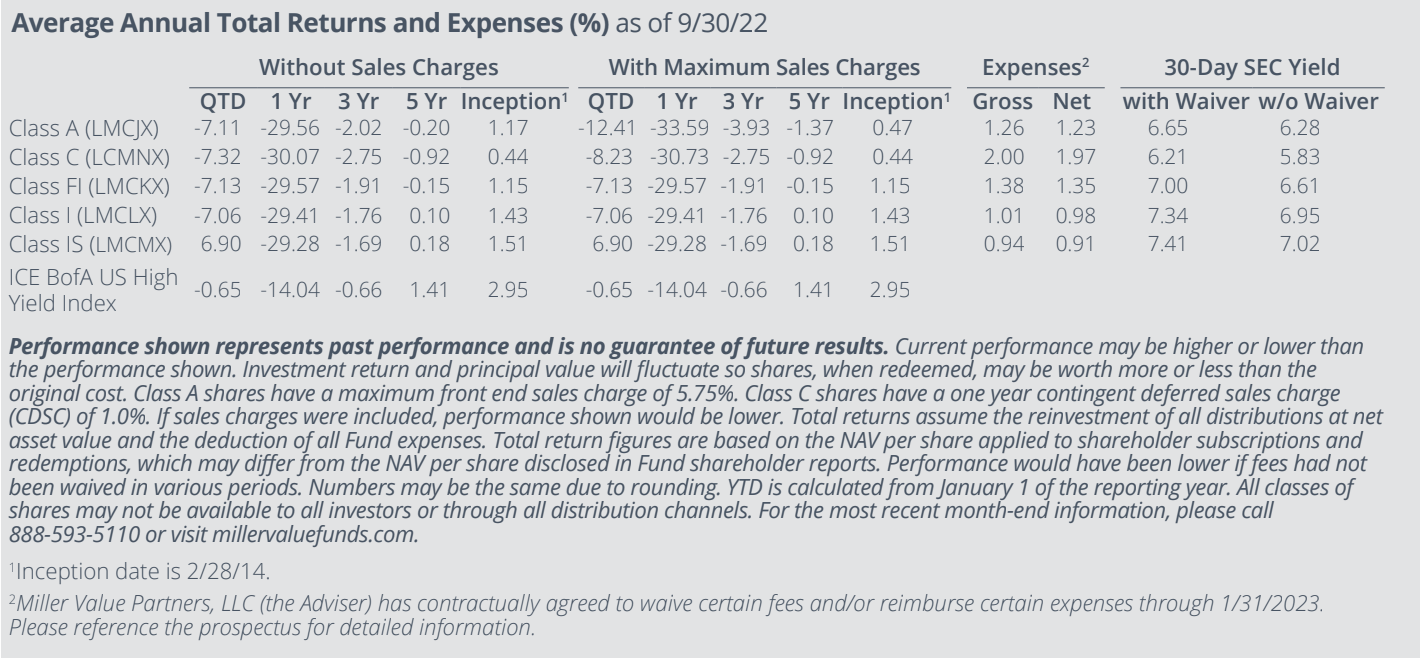
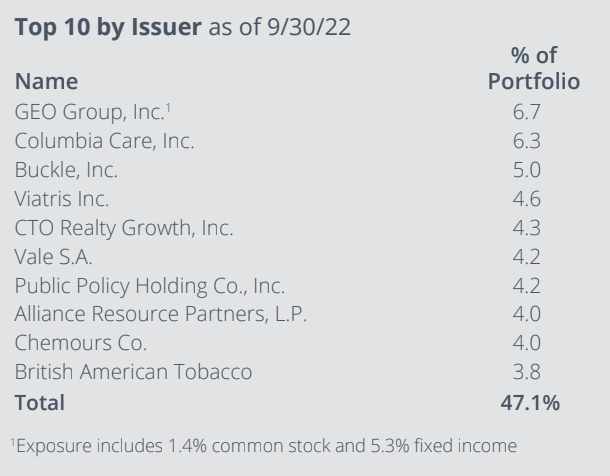
In the third quarter of 2022, the Miller Income Fund’s I-shares returned -7.06% versus a -0.65% return for the ICE BofA US High Yield Index. Every market environment is unique for its own reasons, but the current one is special for the severity and persistence of negative returns across asset classes, most notably the “safest” assets.
The Bloomberg US Aggregate Bond index is comprised of investment-grade bonds in the US with a par value outstanding of at least $100 million and with at least one year until maturity. Its holdings include everything from government debt to asset-backed securities and corporate bonds, with the effective idea being a representation of the investment-grade US bond market. Prior to this year, the index only had one occasion since inception in 1976 with three consecutive calendar quarters of negative returns – the third and fourth quarters of 1979 followed by the first quarter of 1980, causing a cumulative loss of 12.6%. The past three quarters of negative performance have eclipsed that period with a total loss of 14.6%.
The last time US bonds lost value for three consecutive quarters actually marked a multi-decade turning point for inflation and the bond bear market. Is it possible that the most recent string of unprecedented bond volatility and bad returns could mark the end of a shorter bond bear market and a broader return to the centuries-long pattern of falling interest rates?
No one knows, but it seems unlikely given today’s fundamental backdrop. Unemployment is still at a five-decade low, and while tightening financial conditions and an economic slowdown are contributing to a pullback in asset prices and a pause in the housing market, the US still has too little housing. Soaring mortgage costs have put an interlude in home price appreciation, but home prices are still up more over the past six months than it costs to finance a house for a full year at today’s 30-year fixed rate, even after the cost has risen to a two-decade high. Recent data also show that rents have gone up at the same rate over the past twelve months as it costs to finance ownership of the asset.

Moreover, while the Fed is hiking the cost of money, the lower bound of the Federal funds target rate at the time of this writing is 3.00%, and the market expects it to go to 3.75% in two weeks. It is an oversimplified but instructive exercise to compare this cost of money to the rate at which things that cost money are going up, and it suggests the Fed could still be “behind the curve.” People often criticize the Fed for being “backwards-looking” and citing trailing-twelve-month figures instead of focusing on leading indicators. However, the most up-to-date (but still trailing) information is often under-reported because of the one-month measurement interval. If you just annualize the prior three one-month readings on core PCE (personal consumption expenditures), costs have been going up by more than money costs since June of 2020, when societal responses to COVID caused unemployment to hit 13%. The most recent one-month reading (August) implies annualized inflation of 6.9%, while the trailing-three-month number implies a 5.0% inflation rate, both still well above the cost of money, meaning it still makes sense for those that can afford it to borrow and spend today instead of waiting until tomorrow, meaning that inflationary pressures may still be building.
How are we adjusting the portfolio to account for these conditions? We do not change our process based upon macroeconomic backdrops or predictions; rather, we look for yield trading at compelling prices relative to its future prospects with our base case being a growing economy, which tends to be the case most of the time. A lot of the portfolio today is in smaller-capitalization stocks, which are currently trading at historic discounts to large-caps. Today’s small-cap valuation discount to the market is about the same as it was at the end of 2001, which proved to be an opportune time to buy small-caps for long-term investors. We also own a handful of opportunistic credits that we believe are underfollowed and mispriced. Our marginal focus is always on eliminating our mistakes (of which we make many) and on increasing our allocation to names where we have additional evidence suggesting we are right. A longer-term review of the fund’s performance history will show that forward-looking returns are always best after periods of poor performance, and we expect that today’s net asset value will eventually prove to be a good entry point. As always, we appreciate your support and remain the largest investors in the fund.
Top Contributors
- Alliance Resource Partners (ARLP) was the top contributor for the quarter, rising 28.0%. Alliance reported 2Q22 revenue of $616.5MM, +70.1% year over year (Y/Y) and +33.8% sequentially, ahead of consensus of $542.4MM, and earnings per unit (EPU) of $1.23, +261.8% Y/Y, ahead of analyst expectations for EPU of $0.95. Adjusted Earnings Before Interest, Taxes, Depreciation, and Amortization (EBITDA) for the quarter came in at $266.3MM, or a margin of 43.2%, +565bps Y/Y, as the company sold 8.93MM tons (+13.9% Y/Y) of coal at an average price of $59.33/ton (+43.3% Y/Y). Management provided full-year 2022 (FY22) guidance for coal sales of 35.5-37.0MM tons, at an average price of $59-63/ton, and raised guidance for capex to now come in at $230- 250MM, compared to previous guidance for capex of $220-240MM. The company also raised its quarterly distribution by 14.3% to $0.40/unit, implying an annualized yield of 7.1%.
- Chesapeake Energy Corp (CHK) gained 19.1% in the period. The company reported 2Q22 Adjusted Earnings Before Interest, Taxes, Depreciation, Amortization, and Exploration Expense (EBITDAX) of $1,269MM, +195.8% Y/Y, ahead of consensus of $1,226MM, and Adjusted Earnings per Share (EPS) of $4.87, compared to 2Q21 EPS of $1.64, ahead of analyst expectations for EPS of $3.82. Chesapeake generated adjusted free cash flow (FCF) of $494MM, bringing trailing 12-month (TTM) FCF to $1,663MM, or a FCF yield of 14.4%. Management also raised the company’s base dividend by 10% to $2.20/share, bringing the total quarterly dividend to $2.32/ share, or an annualized yield of ~9.7%. Additionally, the company doubled its existing share repurchase authorization from $1B to $2B and has executed $670MM in repurchases so far through 7/31/22. Collectively, management is guiding for $1.2B in total FY22 dividends, at the midpoint, and $1B in share buybacks, implying total FY22 shareholder returns of $2.2B, or ~19.1% of the company’s market cap.
- The Buckle, Inc (BKE) had a strong quarter, climbing 14.1%. Buckle reported 2Q23 net sales of $302.0 million, +2.3% Y/Y, slightly below consensus of $304.3 million, and EPS of $1.01, -2.9% Y/Y, ahead of analyst expectations for EPS of $0.89. The company achieved gross margin of 48.1%, in-line with 2Q21 gross margin, as management noted on the earnings call that “markdown inventory continues to be clean.” Comparable store net sales and online sales saw Y/Y growth of 1.6% and 6.5%, respectively. Free cash flow for the quarter was $40.2MM, bringing TTM FCF to $220MM, or a FCF yield of 12.9%.

Top Detractors
- Organon & Co (OGN) was the top detractor for the quarter, falling 30.0%. Organon reported 2Q22 revenue of $1.59 billion, -0.6% Y/Y, ahead of consensus of $1.54 billion, and Adjusted EPS of $1.25, -27.3% Y/Y, in-line with analyst expectations. Adjusted EBITDA for the quarter came in at $512 million (32.3% margin), compared to 2Q21 Adjusted EBITDA of $627 million (39.3% margin). Management revised FY22 guidance for revenue of $6.1-6.3 billion, compared to previous guidance for revenue of $6.1-6.4 billion, to reflect persisting foreign exchange (FX) headwinds, and Adjusted EBITDA margin of 32-34%, compared to prior guidance for a margin of 34-36%, which incorporates ~$110 million of in-process research and development (IPR&D) and milestone expenses from business development. Management’s guidance implies FY22 Adjusted EBITDA of $2.05B, at the respective midpoints, or an Enterprise Value (EV)/EBITDA multiple of ~7.0x.
- The Chemours Co (CC) dropped 22.5% in the period. Chemours reported 2Q22 revenue of $1.92 billion, +15.7% Y/Y, ahead of consensus of $1.84 billion, and Adjusted EPS of $1.89, +57.5% Y/Y, ahead of analyst expectations for EPS of $1.43. Adjusted EBITDA for the quarter came in at $475 million, or a margin of 24.8%, +269bps Y/Y, ahead of consensus of $405.8 million. After initially raising guidance following the 2Q22 earnings beat, management revised FY22 Adjusted EBITDA guidance from $1.48-1.58B to $1.40-1.45B, -6.9% at the respective midpoints, but +9.0% Y/Y. Management noted that the revised guidance was driven by weakness in the company’s titanium technologies segment, characterized by lower demand, especially in Europe and Asia, combined with high input costs. The company guided for FY22 FCF in excess of $575MM (14.0% FCF Yield) as a result of actions taken to reduce FY22 capex from $400MM to $350MM, while also continuing to invest in growth and sustainability initiatives.
- Viatris Inc (VTRS) fell 17.8% during the quarter. Viatris reported 2Q22 revenue of $4.12 billion, -3% Y/Y on an operational basis, below consensus of $4.19 billion, and diluted EPS of $0.26, compared to a net loss per share of -$0.23 in 2Q21, ahead of analyst expectations for EPS of $0.19. The company generated 2Q22 FCF of $718.6 million, bringing TTM FCF to $3,082.9 million, or a FCF yield of 26.6%. In the 1H22, Viatris retired $1.5 billion in debt, which puts the company well on track to achieve its FY22 debt paydown target of $2.0 billion. While the company lowered FY22 revenue guidance to be in a range of $16.2-16.7 billion, compared to previous guidance for revenue of $17-17.5 billion, this revision is solely attributable to the incremental impact of FX headwinds. The company reaffirmed FY22 guidance for Adjusted EBITDA of $5.8-6.2 billion (36.5% margin at midpoint) and FCF of $2.5-2.9 billion, or a forward FCF yield of 23.3%. The company generated approximately $84 million in new product revenues in 2Q22, bringing 1H22 revenues to $205 million, which were primarily driven by interchangeable Semglee in the US, and the company remains on track to achieve ~$600 million (3.7% of FY22 guided revenue at the midpoint) in FY22 new product revenues.
