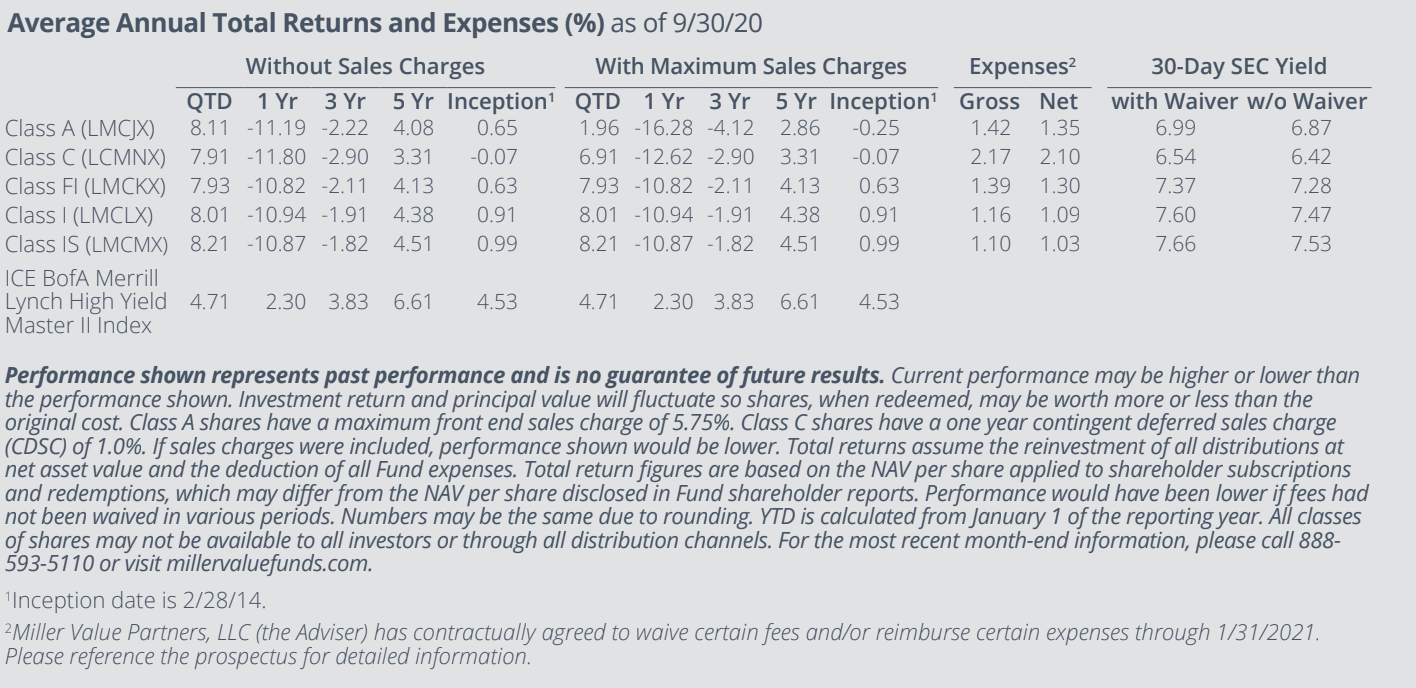
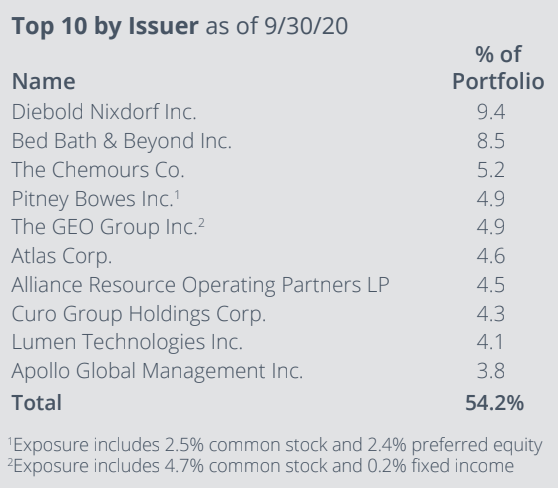
In the third quarter of 2020, the Miller Income Fund generated an 8.01% total return versus 4.71% for the ICE BofA Merrill Lynch High Yield Index. We believe the Fund remains in a position to perform well if the economy continues to improve; indeed, the Fund’s historical performance reflects our procyclical positioning for both better and worse. Our worst results have occurred in periods when economic growth prospects have weakened, while our best results have come when economic growth is improving. The balance of this letter will provide context around recent performance and discuss why we prefer our current positioning to many alternatives.
We are by no means happy with the performance this year, but given that we have intentionally constructed a procyclical portfolio, a discussion of performance would not be complete without macroeconomic context. A variety of letters and symbols crop up in descriptions of the economy. The recession has been unique in the speed of the collapse, with GDP declining in the second quarter at the fastest rate ever recorded. Nominal output in the second quarter of 2020 was 9.5% below the first-quarter level and 10.2% below the peak level reached in the fourth quarter of last year. The speed of the collapse along with a collaborative, societal focus on the virus have led some to speculate that a quick “V-shaped” recovery could be in order. As the letter “V” is symmetric, it is now clear that a “V” is probably the wrong letter to choose from the alphabet soup bowl, unless we are using the Federal Reserve’s definition of “symmetric;” the Fed has effectively admitted that FOMC board members, in fact, did not historically view their stated “symmetric” 2% objective as such (more on this in the Miller Income Fund 4Q2018 letter).

The latest en vogue letter is “K,” in the sense that the recovery varies for different segments of society. As the S&P 500 sits near all-time highs (which tends to benefit the wealthy), the unemployment rate is among the highest levels in history, which disproportionately affects the least affluent. Commentators often fail to parse market data, which actually show a rational and similar “K-shaped” recovery among stocks: Two out of every three stocks in the S&P 1500 ended the third quarter lower than where they began the year, and the median year-to-date performance among the 1,000+ decliners was -26%. Large, fast-growing technology companies (which have little to no yield) have fared the best, while small cyclical businesses have done the worst. The contrast is most apparent when comparing the S&P 500 Growth (SGX) index’s +20.6% year-to-date performance against the S&P 600 SmallCap Value (SMLV) index’s -22.9% return over the past nine months.
The ongoing divergence between large growth stocks and small value stocks is not some overdone phenomenon that must mean-revert. It has very real underlying drivers, the most obvious of which is fundamental performance. Technology companies which reside on the other side of a screen benefit from the shift to stay-at-home lifestyles. More broadly though, if multiples on stocks did not change, a scalable and fast-growing, capital-light business should outperform slower- growing, more labor-intensive or capital-intensive businesses. The question then becomes, “At what point does the valuation discrepancy make it prohibitively unlikely that large-cap growers will continue to outperform small-cap value?”
Valuation multiples, whether in relation to sales or free cash flow, have underlying macroeconomic drivers in addition to expectations for company-specific performance. The risk-free rate, or the ten-year government bond yield, is the starting point for all valuation. It is the nominal rate of return one can expect for lending to the US government over the next decade on a buy-and-hold basis. At the end of the third quarter, that rate was 0.68%. Compare this to the bond market’s expectation for inflation over the next decade: 1.63% per year.1 In other words, investors holding US government bonds today are willing to accept a real loss in purchasing power of almost one percent per year over the next decade in exchange for the privilege of lending to our esteemed public sector. These rates of return hardly amount to an “opportunity cost” for anything. Why not buy a cash-incinerating growth company whose profits will supposedly materialize in five or ten years? In addition, companies putting up big revenue growth in a low-growth environment have a psychological scarcity premium.
However, nothing lasts forever, even cold November rain. It is tough to imagine a worse starting point than today for the ten-year “risk-free” bond. Policymakers have enacted record amounts of fiscal stimulus with more on the way, while officials at both the Federal Reserve and European Central Bank have said they intend on letting inflation run above their long-term goals while aggregate demand returns in a potentially supply-constrained environment; this certainly seems like a good recipe for higher rates. If bond prices revert to a 1.63% yield, a rate which would only match the market’s expectation for inflation over the next decade and still imply an unattractive 0% real rate of return, investors holding ten-year bonds would lose just over 8% in conjunction with that move alone. To put that in perspective, when the investor purchased the bond, they expected a total nominal gain of 7% over the course of an entire decade. This “safe” bond position would lose more money in a span of potentially months or even weeks than it was supposed to generate over the course of an entire decade, which does not appear to be a good risk/return skew. It would not be unreasonable for such a reversal to coincide with expectations for higher growth and inflation along with an investor preference shift toward more value-oriented securities.
Given the aforementioned backdrop, we do not find fixed- income portfolios which prioritize stability all that compelling. Historically, the Fund has put up its best results after risk-off swoons, which is where we sit today, and the economy has a lot of runway to get back to where it was. We continue to tweak portfolio construction in an effort to reduce downside volatility without sacrificing upside, and we are highly optimistic about our ability to generate compelling volatility-adjusted returns from this starting point. While half of the portfolio is in bonds, the weighted average price on our positions is still 15 points below par with a 9.8% weighted average yield, and these are credits where our work suggests they can outperform their own yield and in many cases move well beyond par. The other half of the portfolio is comprised of equities which yield 6.5% in aggregate; we believe all are meaningfully undervalued.2
As always, we remain the largest shareholders in the Fund and welcome all questions and comments.
Top Contributors
- Bed Bath & Beyond 5.165% unsecured bond due 2044 was the top contributor over the quarter, advancing 32.0% amidst a flurry of positive news highlighting success in management’s turnaround initiatives. The company reported Q1 net sales of $1.3Bn driven by digital sales growth of 82% year-over-year (Y/Y). Management announced plans to close 200 Bed Bath stores over the next two years, which combined with additional selling, general and administrative (SG&A) expense reductions, should generate $250M-$300M in annualized savings. Throughout the quarter, the company announced several positive developments, including the potential for $350M-$450M of additional asset sales, the opportunity for working capital improvements from the $1Bn inventory reduction program, positive comparable same-store sales growth and free cash flow (FCF) in June and July, as well as a settlement with 1-800-Flowers for the sale of PMall for $245M. Bed Bath also lifted the restriction on debt reduction and commenced a tender offer to purchase up to $300M 2034 and 2044 notes, or 20% of its long-term debt with cash on hand. Additionally, CEO Mark Tritton continued to build out the executive management team, including the appointment of Lynda Markoe as Chief People & Culture Officer, Wade Haddad as Senior VP of Real Estate & Construction, and Juan Guerrero as Chief Supply Chain Officer.
- Diebold Nixdorf 8.5% unsecured bond due 2024 rose 17.2% during the quarter after the company reported Q2 revenue of $891M and Earnings Before Income, Taxes, Depreciation and Amortization (EBITDA) of $122M (+15% Y/Y), both beating analyst estimates of $828M and $66M, respectively. Gross margins of 29.6% rose 500 basis points (bps) Y/Y on continued execution in DN Now initiatives while EBITDA margins of 13.7% rose 440bps Y/Y. Management maintained fiscal year 2020 (FY20) guidance with revenue of $3.7Bn- $3.9Bn and EBITDA of $400M-$440M and increased FCF guidance from flat to $25M at the midpoint. Diebold exited Q2 with $457M in cash and leverage of 4.6x. Additionally, Diebold announced a concurrent $700M 9.375% and €350M 9.0% senior secured debt offering due 2025. The proceeds will be used together with cash on hand to refinance the existing Term Loan A, the Term Loan A-1, the $69M revolving credit facility due December 2020, and an additional $125M under the April 2022 revolving credit facility. The transaction extends the company’s weighted average maturity by 1.5 years and is leverage neutral.
- The Chemours Co (CC) rose 37.8% over the period. The company reported Q2 revenue of $1.093Bn, topping consensus of $1.087Bn by 1% while EBITDA of $166M beat estimates of $160M by 4%. Free cash flow of $50M improved $167M Y/Y, driving a Q2 cash balance of $1Bn and total liquidity of $1.4Bn. Management remains on track to achieve $160M of cost and $125M of capital expenditure (capex) reductions in FY20. Additionally, the company repaid the $300M preemptive draw on their revolving credit facility during August and September.

Top Detractors
- Chico’s FAS (CHS) was the top detractor over the quarter, falling 29.5% despite generating positive FCF of $7M in Q2, a $112M sequential improvement in a very challenging operating environment. Revenue of $306.2M was below consensus of $332.7M but +9.2% quarter-over-quarter (Q/Q) on the backs of strong digital performance and store re-openings. Digital sales in the apparel group and intimates each grew double digits with Soma surging 70% Y/Y. Gross margin of 14.6% improved 18% sequentially while SG&A expense declined $63.7M driven by ongoing expense reduction initiatives. Management announced a strategic real estate review whereby each store’s cash flow and profitability will be evaluated in an effort to optimize the fleet.
- Chaparral Energy 8.75% unsecured bond due 2023 declined 52.3% during the period, though its small weight meant only 38bps of value detraction. The company entered into a restructuring support agreement with 78% of holders of both the loans outstanding and 8.75% senior notes due 2023. Chaparral will fully equitize the $300M senior notes and raise an additional $35M through a fully back-stopped second-lien convertible notes offering. The company is expected to re-emerge from Chapter 11 in October.
- Apollo Global Management (APO) dropped 9.5% over the period. The company reported Q2 distributable earnings of $0.46, just below consensus of $0.48 and the quarterly dividend of $0.49/share (4.7% annualized yield). Pretax fee-related earnings of $259M ($0.59/share) topped estimates of $242M ($0.55/share) driven by higher advisory and transaction fees while management fees of $401.8M were in-line. Assets under management (AUM) of $413.6Bn rose 31% sequentially with fee-earnings AUM growth of 36% to $329.8Bn driven by insurance transactions and $16Bn of gross inflows. Permanent capital of $246Bn represents 60% of total assets under management.
